


An online survey was developed and conducted by Exhibit Surveys and Lippman Connects in February 2015. Eighty-five attendee acquisition/attendee marketers responded to the “Attendee Acquisition Benchmarks & Practices, Winter 2015 Executive Summary” based on their largest event.
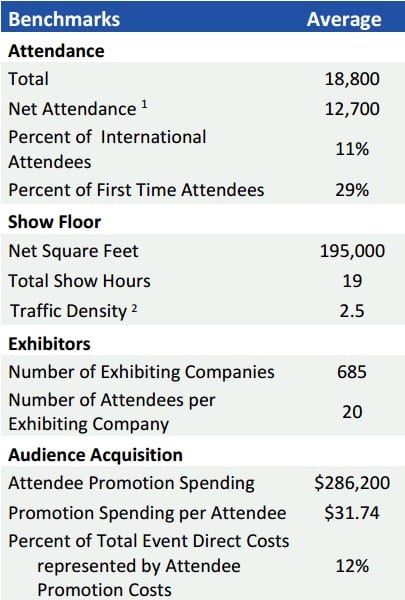
Exhibit Surveys has collected these benchmarks to enable comparisons among event organizations. This information can be used to identify improvement opportunities and, when applied consistently over time, can help to gauge the effectiveness of improvement efforts.
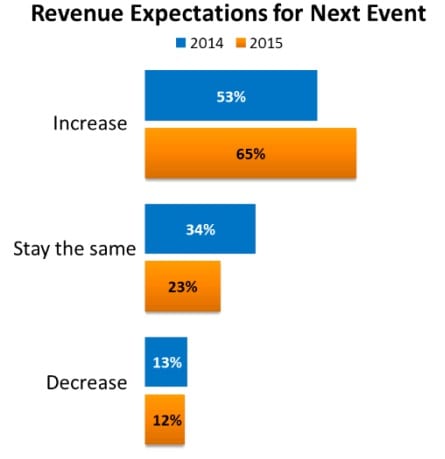
Respondents are more optimistic this year with two-thirds expecting revenue growth versus only around half last year.
 The largest attendee acquisition challenges are capturing the attention of the audience/prospects (64 percent) and identifying new prospects (60 percent). Buying lists is the top method used to identify new prospects. Partnering with industry organizations, using social networking/social media and attending other industry tradeshows are also mentioned.
Two-thirds have changed to more targeted marketing in their efforts to attract and retain more attendees. More than half have improved their mobile app. Four-in-ten provided exhibitors with tools to invite customers, have expanded their education program or have developed more consistent event branding.
All events are using email marketing, digital and social marketing methods. Seventy percent are using SEO/Paid search and 63 percent use telemarketing.
In the coming year, two-thirds plan to increase their social media marketing budget, and more than half plan to increase spending for digital marketing. While one-fifth plan to increase spending on direct mail in the coming year, another fifth plan to decrease the spending. Similarly, 15 percent plan to increase spending on print advertising while 16 percent plan to decrease the spending.
Virtually all respondents use social media for marketing. Efforts are primarily measured via attendee registrations, numbers of follower/likes and views of content. However, just a fifth consider their efforts to be extremely or very successful.
Only half of the respondents offer match-making programs and only half of those consider their program to be even somewhat effective.
Less than a fifth say their event is involved in creating a 365 year-round experience/community for attendees and half say their efforts have only been somewhat successful.
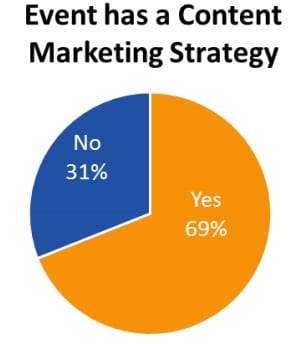
Seven-in-ten have a Content Marketing strategy – using the event’s content to market and drive attendees to the event. It is considered to be most effective for enhancing the brand – less so for the areas of attendee registration, attendee retention and creating a year-round community.
Additional Findings
- When comparing Exhibit Sales professional’s responses from last fall’s “Issues and Trends in Exhibit Space and Sponsorship” study, Attendee Marketers feel that support from Senior Management is stronger with their time but lower for budget and staffing.
- Three-quarters of respondents are involved in setting strategies for attendee registration and pricing. Only a third are involved in the content of their educational programs.
- Nine out of 10 are planning to conduct market research or analytical projects this year. Most will conduct quantitative surveys of attendees. Less than 20 percent are using advanced statistical techniques.
Composition of Respondents
- 100 percent of respondents are involved in attendee acquisition/attendee marketing. 79 percent have director level or higher titles. They have an average of 15 years involvement in attendee acquisition.
- Respondents are from a mix of Association organizers (64 percent) and Independent organizers (36 percent). Fifty-four percent work on events that have less than 125,000 net square feet of exhibit space.
- Respondents’ events are from 14 industries. Medical & Healthcare (16 percent), Building, Construction, Home & Repair (12 percent), Raw Materials & Science (12 percent), and Education, Associations, Libraries (11 percent) are the most represented.
For more information, contact Jeff Stanley at 732-704-1324 or jeff@exhibitsurveys.com
Note: The survey respondents appear to represent a higher proportion of larger shows than the event industry as a whole. This should be taken into consideration when reviewing the findings.