


Center for Exhibition Industry Research (CEIR) released 2015 first quarter data collected for the annual CEIR Index report.
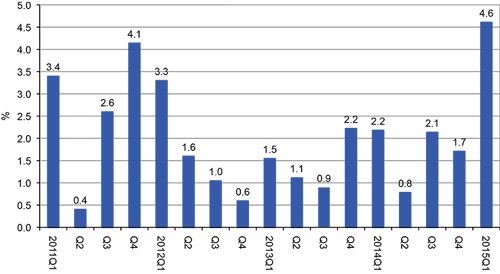
Despite the severe winter, the performance of the business-to-business exhibition industry, as measured by the CEIR Total Index, posted a year-on-year gain of 4.6 percent (see Figure 1). This increase reflects strong industry growth, marking it as the highest increase since the second quarter of 2007.
Figure 1: Quarterly CEIR Total Index for the Overall Exhibition Industry,
Year-on-Year Growth, 2011 Q1 – 2015 Q1
“The performance in the first quarter was remarkable considering that the East Coast was frequently paralyzed under severe winter weather,” noted CEIR Economist Allen Shaw, Ph.D., Chief Economist for Global Economic Consulting Associates Inc.
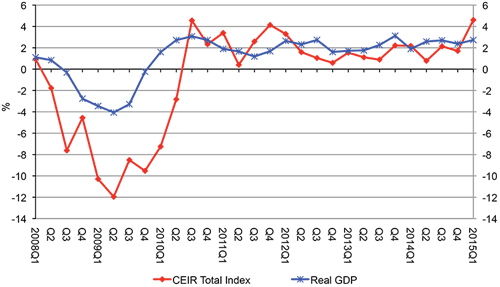
2015 Q1 also marked the 19th consecutive quarter of year-on-year growth. While the growth of the exhibition industry lagged behind the GDP during most of last three years, the exhibition industry outperformed the macro economy as real GDP gained 2.7 percent year-on-year (see Figure 2).
Figure 2: Quarterly CEIR Total Index for the Overall Exhibition Industry vs. Quarterly Real GDP, Year-on-Year Growth, 2008 Q1 – 2015 Q1
 The year-on-year gain spread across all 14 sectors, especially Building, Construction, Home & Repair and Government. For the overall exhibition industry, all four metrics in the first quarter posted year-on-year gain. The strongest metric was in Real Revenues, which rose an impressive 7.3 percent, followed by Net Square Feet – increasing by 4.1 percent. Exhibitors increased 3.3 percent, whereas Professional Attendance could have been influenced the most by the severe weather and yet it rose a relatively strong 3.7 percent (see Figures 3 and 4).
Figure 3: Quarterly CEIR Metrics for the Overall Exhibition Industry,
Year-on-Year Growth, 2015 Q1
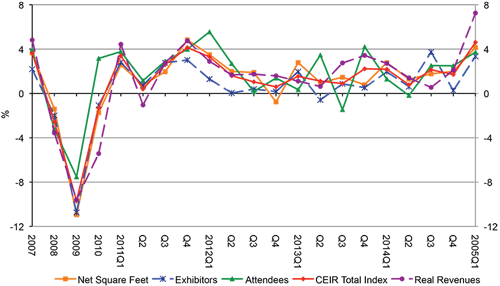
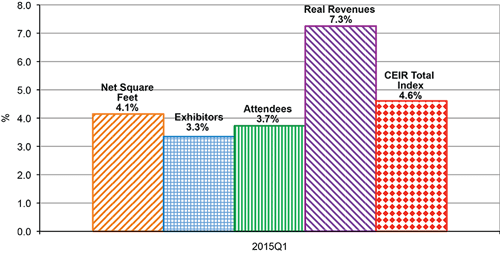 Figure 4: Quarterly CEIR Metrics for the Overall Exhibition Industry,
Year-on-Year Growth, 2007-2015 Q1
 “We are very encouraged to see that the exhibition industry is continuing its upward climb. While industry growth has been moderate, the strong performance of Q1 is certainly offering positive indicators for the near future,” said CEIR President & CEO Brian Casey, CEM. “After two challenging recessions, it’s wonderful to see this kind of performance despite the impact of weather.”
As an objective measure of the annual performance of the exhibition industry, the CEIR Index measures year-over-year changes in four key metrics to determine overall performance: Net Square Feet of Exhibit Space Sold; Professional Attendance; Number of Exhibiting Companies; and Gross Revenue. The CEIR Index provides data on exhibition industry performance across 14 key industry sectors: Business Services; Consumer Goods; Discretionary Consumer Goods and Services; Education; Food; Financial, Legal and Real Estate; Government; Building, Construction, Home and Repair; Industrial/Heavy Machinery and Finished Business Outputs; Communications and Information Technology; Medical and Health Care; Raw Materials and Science; Sporting Goods, Travel and Entertainment; and Transportation.
Click here for information on how to purchase the complete CEIR Index Report, which analyzes the 2014 exhibition industry and provides a future outlook for the next three years.