


The Center for Exhibition Industry Research (CEIR), an organization which advances the growth, awareness and value of exhibitions and other face-to-face marketing events, released on Dec. 16 third quarter data collected for the annual CEIR Index report. Performance of the business to business exhibition industry, as measured by the CEIR Total Index, continued to improve during the third quarter of 2014.
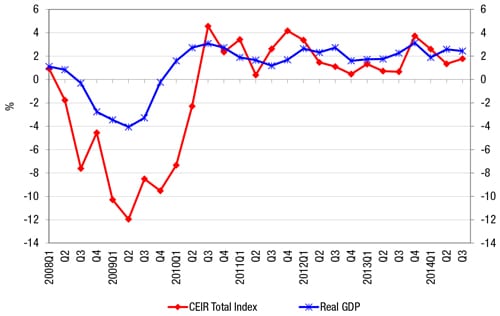
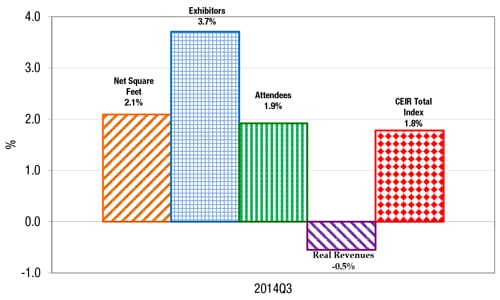
The growth accelerated from a revised year-on-year gain of 1.3 percent in the second quarter to 1.8 percent (see Figure 1). The third quarter of 2014 marked the 17th consecutive quarter of year-over-year growth. Nonetheless, the growth of the exhibition industry index lagged a bit behind GDP growth for the second straight quarter, in contrast to the previous two quarters (2014Q1 and 2013Q4) where exhibitions grew a bit faster than GDP.
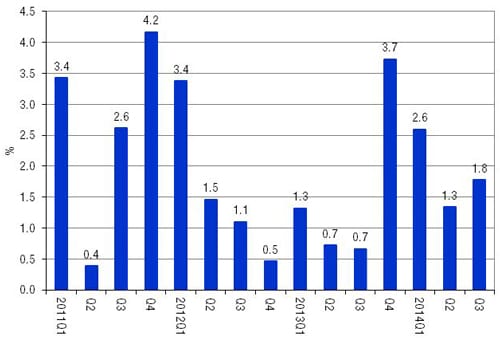
The growth of the CEIR Total Index averaged 1.9 percent during the first three quarters of 2014, just 0.1 percent point shy of the 2.0 percent forecasted for 2014 as a whole, as published in the 2014 Predict Report.
“We are very pleased by the third quarter results and confirm our forecast that the exhibition industry will gain momentum,” commented CEIR’s economist Allen Shaw, Ph.D., Chief Economist for Global Economic Consulting Associates Inc.
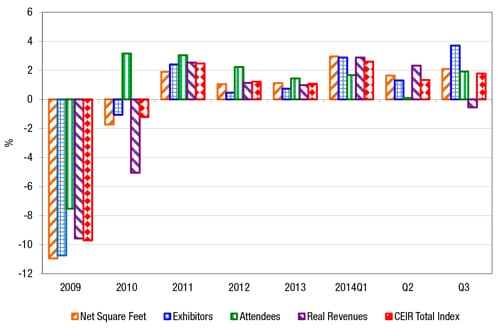
All metrics except real revenues posted year-on-year gains in the third quarter. The strongest performer was the number of Exhibitors, which rose 3.7 percent. Net Square Feet increased 2.1 percent whereas Professional Attendance was up 1.9 percent (see Figures 3 and 4). Nominal revenues increased only a modest 1.2 percent year-on-year, weighted down by a moderate decline in consumer goods and retail trade exhibitions. Adjusted for inflation, real revenues declined by 0.5 percent year-on-year.
For more information about the CEIR Index, an Analysis of the 2013 Exhibition Industry and Future Outlook, contact CEIR Managing Director Cathy Breden, CAE, CMP, at cbreden@ceir.org or (972) 687-9201.


