


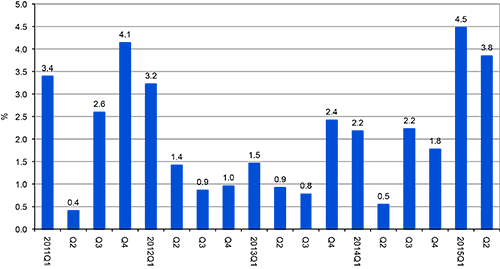
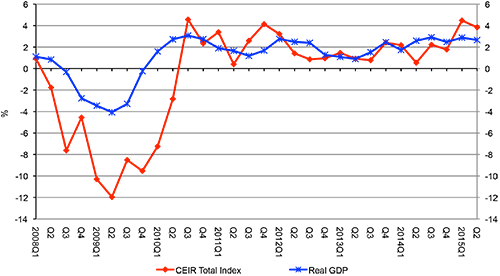
After a sharp increase in the first quarter, the performance of the business to business exhibition industry, as measured by the CEIR Total Index, remained relatively strong during the second quarter of 2015, posting a year-on-year gain of 3.8 percent (see Figure 1). This growth is the second highest rate since the second quarter of 2007 and also marked the 20th consecutive quarter of year-on-year growth.
Figure 1: Quarterly CEIR Total Index for the Overall Exhibition Industry,
Year-on-Year Growth, 2011Q1-2015Q2
Over the three years through 2014, the exhibition industry growth generally lagged the pace of GDP, but the industry has now outperformed the macroeconomy for two quarters straight by a wide margin (see Figure 2). “The second-quarter results are very promising. They show that the exhibition industry is on a solid position for robust growth this year,” says CEIR Economist Allen Shaw, Ph.D., Chief Economist for Global Economic Consulting Associates, Inc.
Figure 2: Quarterly CEIR Total Index for the Overall Exhibition Industry Vs. Quarterly Real GDP, Year-on-Year Growth, 2008Q1-2015Q2
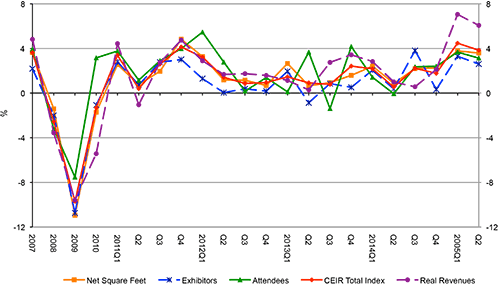
All four exhibition metrics in the second quarter posted year-on-year gains. The strongest metric was Real Revenues, which rose an impressive 6.1 percent, followed by Net Square Feet with an increase of 3.6 percent. Professional Attendance rose 3.1 percent, whereas Exhibitors increased 2.6 percent (see Figures 3 and 4).
Figure 3: Quarterly CEIR Metrics for the Overall Exhibition Industry,
Year-on-Year Growth, 2015Q2
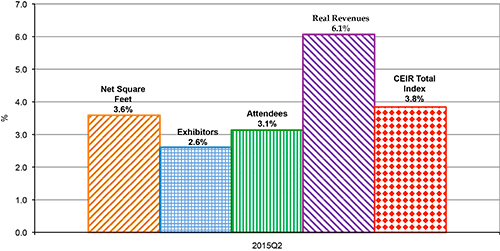 Figure 4: Quarterly CEIR Metrics for the Overall Exhibition Industry,
Year-on-Year Growth, 2007-2015Q2
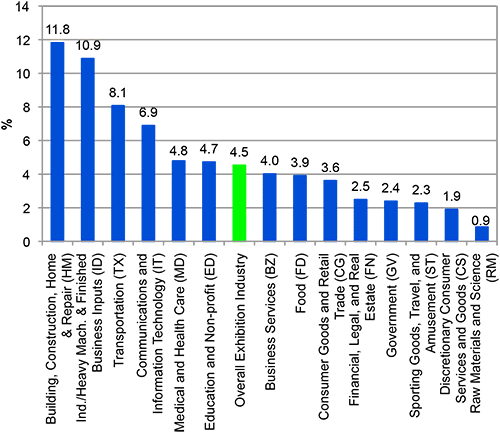
All 14 sectors enjoyed year-on-year gains during the first half of 2015. So far in 2015, the leading sectors have been Building, Construction, Home & Repair (HM), which increased by a whopping 11.8 percent, and Industrial/Heavy Machinery and Finished Business Inputs (ID), which has jumped 10.9 percent. Conversely, the weakest performing sectors are Raw Materials and Science (RM), gaining by only 0.9 percent, and Discretionary Consumer Services and Goods (CS), rising a moderate 1.9 percent.
Early this year the outlooks for Education and Nonprofit (ED) and Government (GV) sectors were pessimistic as tight budgets and sluggish government employment were expected to shrink the potential attendee lists for those exhibitions. The outlook was especially grim for exhibitions catering to government services, such as military applications. However, ED and GV have grown unexpectedly by respectable paces so far this year. After several down years, the expansion in these areas may reflect some pent-up demand by state and local employees looking to retool their enterprises. These stronger than expected gains in ED and GV provide an unexpected boost to the overall performance of the exhibition industry (see Figure 5).
Figure 5: CEIR Overall Index by Sector, Year-on-Year percent Change, 2015H1
As an objective measure of the annual performance of the exhibition industry, the CEIR Index measures year-over-year changes in four key metrics to determine overall performance: Net Square Feet of Exhibit Space Sold; Professional Attendance; Number of Exhibiting Companies; and Gross Revenue. The CEIR Index provides data on exhibition industry performance across 14 key industry sectors: Business Services; Consumer Goods; Discretionary Consumer Goods and Services; Education; Food; Financial, Legal and Real Estate; Government; Building, Construction, Home and Repair; Industrial/Heavy Machinery and Finished Business Outputs; Communications and Information Technology; Medical and Health Care; Raw Materials and Science; Sporting Goods, Travel and Entertainment; and Transportation. Click here for information on how to purchase the complete CEIR Index Report, which analyzes the 2014 exhibition industry and provides a future outlook for the next three years.
Predict: CEIR’s Annual Outlook Conference will be held 16-17 September 2015 at the JW Marriott in Chicago, where an expert economist will provide an outlook on the global economy and how the exhibition industry is faring nine months into the year. Visit www.ceir.org/predict for more details.